What Is a Good Page Load Time? (2026 Benchmarks)
The honest answer with real numbers: what counts as fast, what counts as acceptable, and what is quietly killing your conversions. Based on Google, Akamai, and Deloitte data.
If you want the short answer: under 2 seconds for desktop, under 3 seconds for mobile. Anything slower and you are losing visitors before they see your page.
But the short answer is useless without context. Where did those numbers come from? What are you measuring, exactly? And why does Google’s own home page load in 0.4 seconds while the average business website takes 8 seconds on mobile?
Let’s break it down properly.

What “page load time” actually means
Here is the first problem. “Page load time” has no single definition. Depending on who is measuring and what tool they use, it can mean any of these:
- Time to First Byte (TTFB): How long before the server sends the first byte of data back. This measures server responsiveness, not user experience.
- First Contentful Paint (FCP): When the browser renders the first piece of visible content. Could be a background color, a logo, a single line of text.
- Largest Contentful Paint (LCP): When the main content block has fully rendered. This is the metric Google uses for ranking. It is the closest proxy to “when does the page feel loaded to the user.”
- Time to Interactive (TTI): When the page is not just visible but fully responsive to user input. No more JavaScript parsing in the background.
- Onload event: When all resources (images, scripts, stylesheets) have finished downloading. This is what most testing tools report by default. It is also the least useful metric, because a page can be fully interactive long before the onload event fires.
Google tracks LCP as the headline metric. If you are asking “is my page fast enough,” LCP is what you should be looking at.
For a deeper dive into each of these metrics and how they connect to Google’s ranking signals, see our complete web performance guide.
The benchmarks: what is good, acceptable, and bad
Google’s own grading scale for LCP, pulled directly from their PageSpeed Insights scoring:
| Rating | LCP (seconds) | What it means |
|---|---|---|
| Good | 0–2.5 | Fast. Users perceive the page as near-instant. |
| Needs improvement | 2.5–4.0 | Noticeable delay. Some mobile users start bouncing. |
| Poor | 4.0+ | Slow. Over half your mobile visitors may leave. |
The same thresholds apply to FCP. For INP (Interaction to Next Paint, the responsiveness metric), good is under 200ms. For CLS (Cumulative Layout Shift), good is under 0.1.
Here is how the broader web actually performs. DebugBear’s 2025 analysis of 4 million pages found that the median mobile page loads in 1.9 seconds for FCP and 2.6 seconds for LCP. On desktop, those numbers drop to 1.7 seconds and 2.2 seconds respectively.
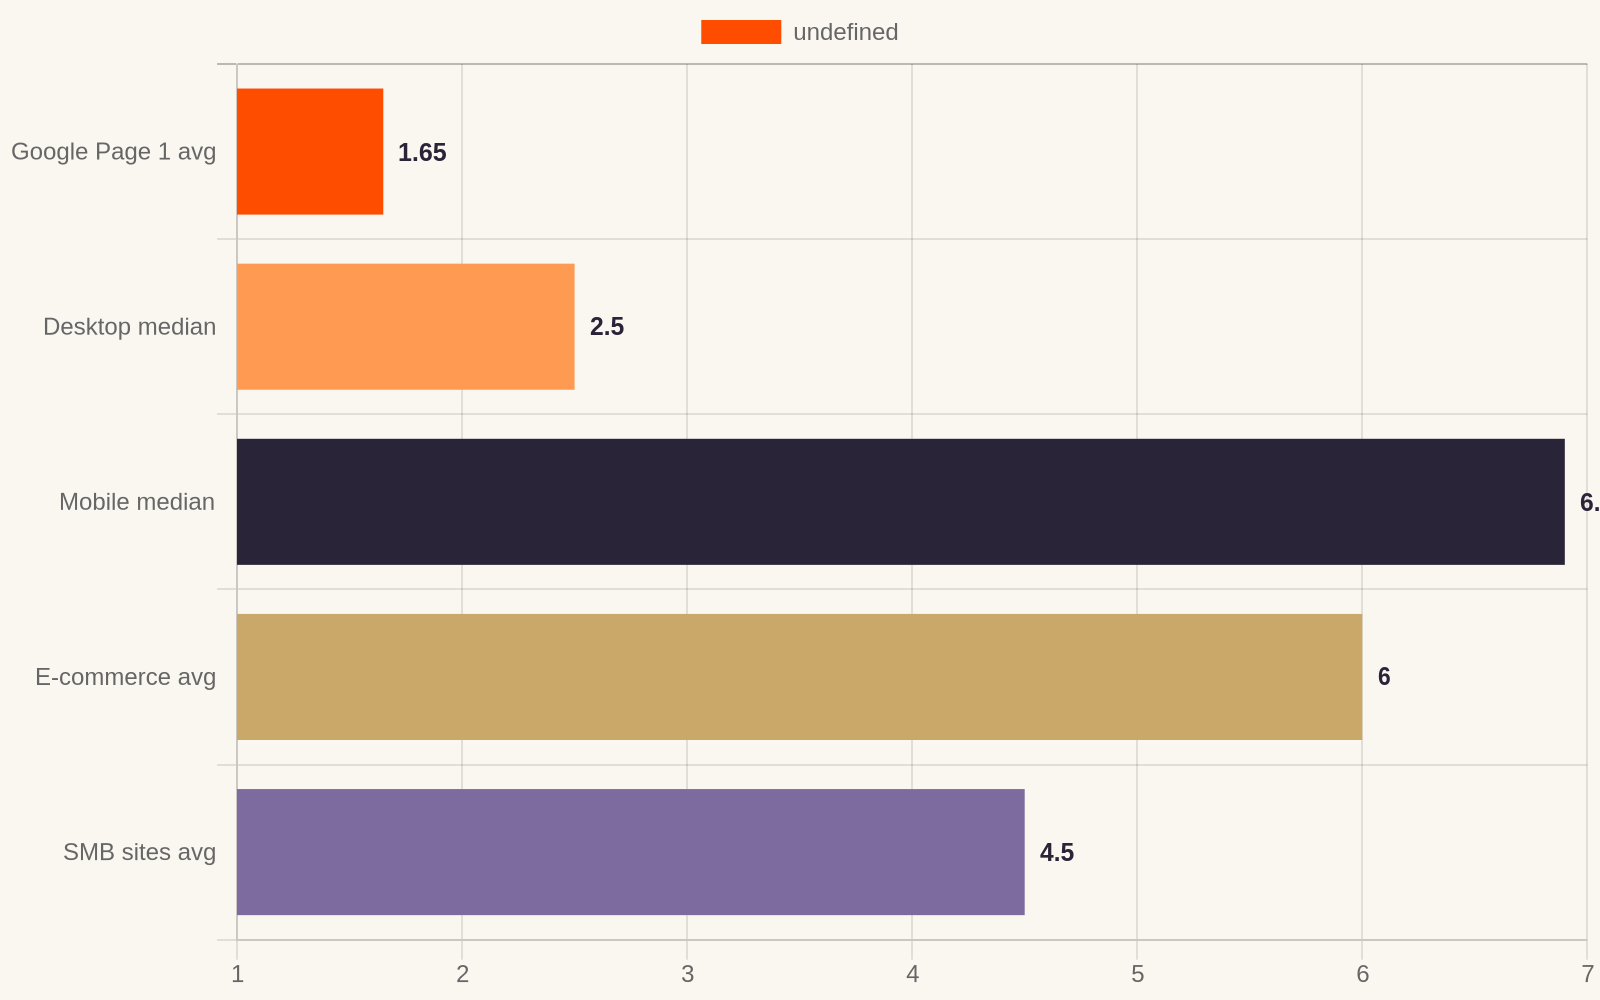
But medians hide the distribution. A page loading in 1.9 seconds on average might load in 0.8 seconds for a user on fiber in Tokyo and in 8 seconds for a user on 3G in rural India. The median is not your user.
Industry-specific numbers
Different industries have different baselines. Here is what the average looks like by sector, based on data from ToolTester’s analysis of the top 100 websites globally:
- Retail and e-commerce: 6.0 seconds on mobile. This is where speed matters most because slow pages directly reduce revenue.
- Media and publishing: 5.2 seconds. Content-heavy sites with lots of images.
- Technology and SaaS: 3.8 seconds. Better than average, because tech companies tend to optimize.
- B2B and services: 4.5 seconds. Most small business sites fall here.
- Google page 1 results: 1.65 seconds. The sites that actually rank on Google’s first page load roughly twice as fast as the overall average. That is not a coincidence.
If you want to know where you stand, run your site through PageSpeed Insights and compare your mobile LCP to these numbers.
The 3-second threshold and bounce rate
Google’s original research from 2017 found that 53% of mobile visits end in a bounce if the page takes longer than 3 seconds to load. That number has been cited in thousands of articles since, and it is still the most widely referenced benchmark in the industry.
The relationship between load time and bounce rate is not linear. It is a curve that starts gentle and steepens fast.
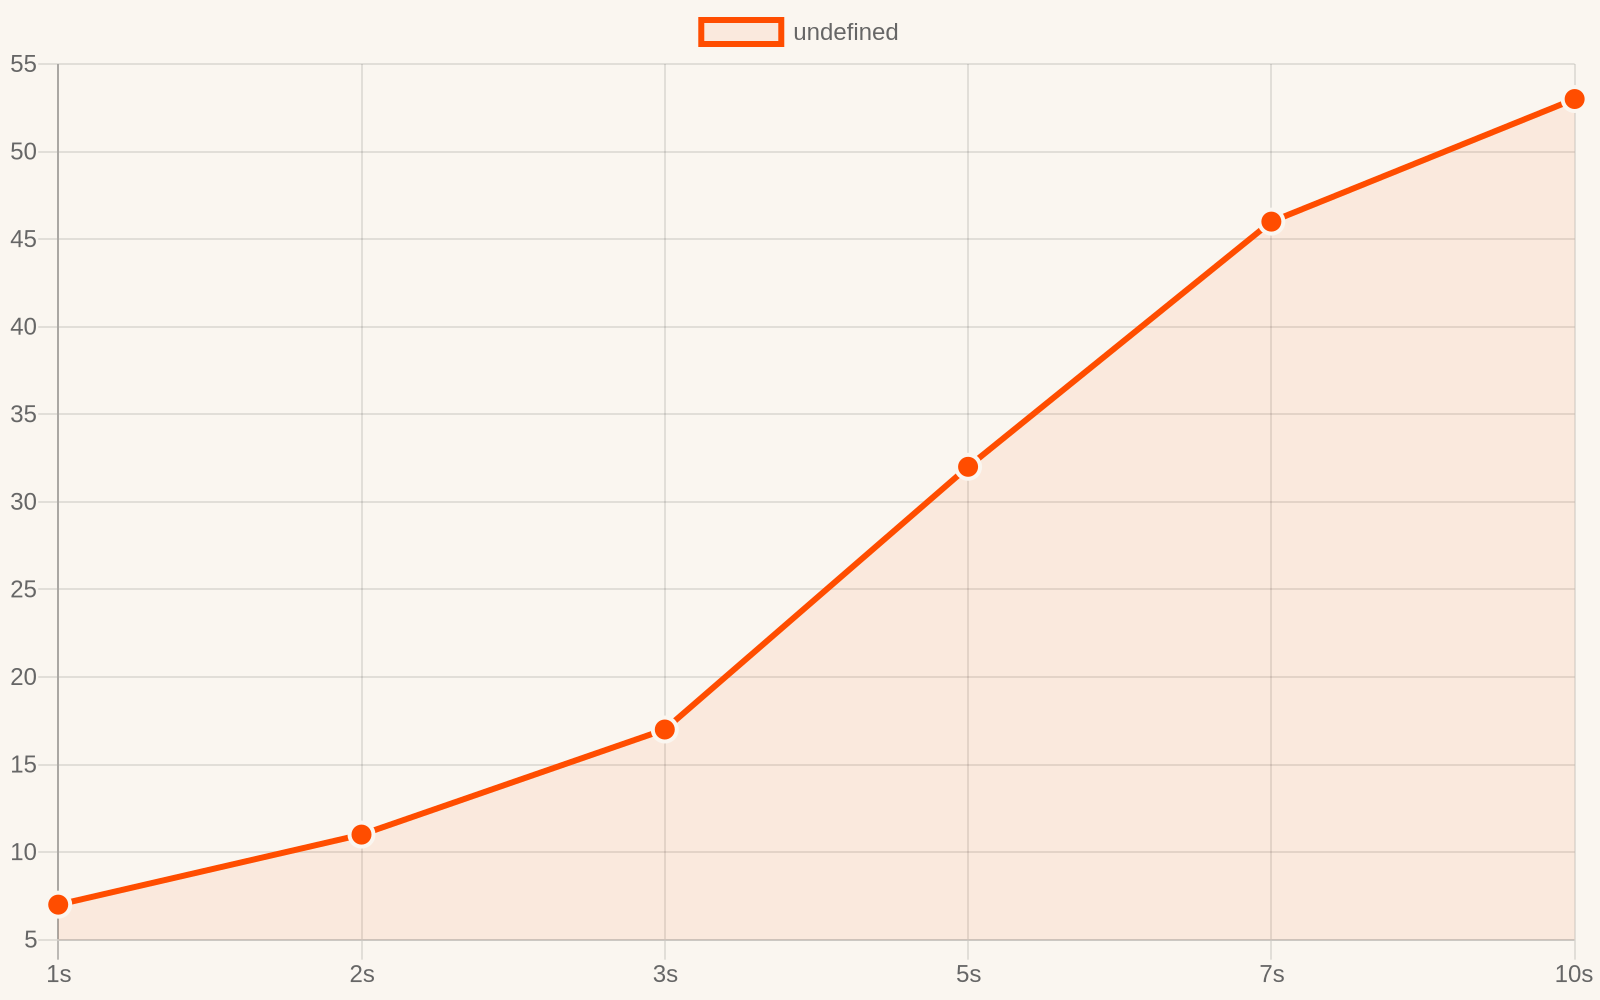
Akamai’s follow-up study in 2019 confirmed the pattern with different data. They found that a 2-second delay in page load time increased bounce rates by 103%. Not from a fast baseline to a slightly slower one. From 1 second to 3 seconds.
Here are the bounce rate thresholds from Google’s and Akamai’s combined data:
| Load time | Mobile bounce rate | What happens |
|---|---|---|
| 1 second | ~7% | Users perceive the page as instant. Almost nobody bounces for speed reasons. |
| 2 seconds | ~11% | Small increase. Still feels fast. |
| 3 seconds | ~17% | The tipping point Google identified. Users start to notice the wait. |
| 5 seconds | ~32% | Nearly a third of visitors leave. |
| 7 seconds | ~46% | Almost half are gone. |
| 10 seconds | ~53%+ | The majority have left. Those who remain are likely on fast connections. |
The curve flattens after 10 seconds not because people get more patient, but because there is nobody left to lose. If someone is still waiting at 10 seconds, they are either on a fast connection experiencing a different problem, or they have a very specific reason to wait.
For a deeper look at how this translates to lost revenue, see our breakdown of website speed vs. customer retention.
How load time affects conversion rate
Bounce rate tells you how many people stay. Conversion rate tells you how many of those who stay actually buy, sign up, or contact you.
The relationship between speed and conversions is even more dramatic than the bounce rate curve.
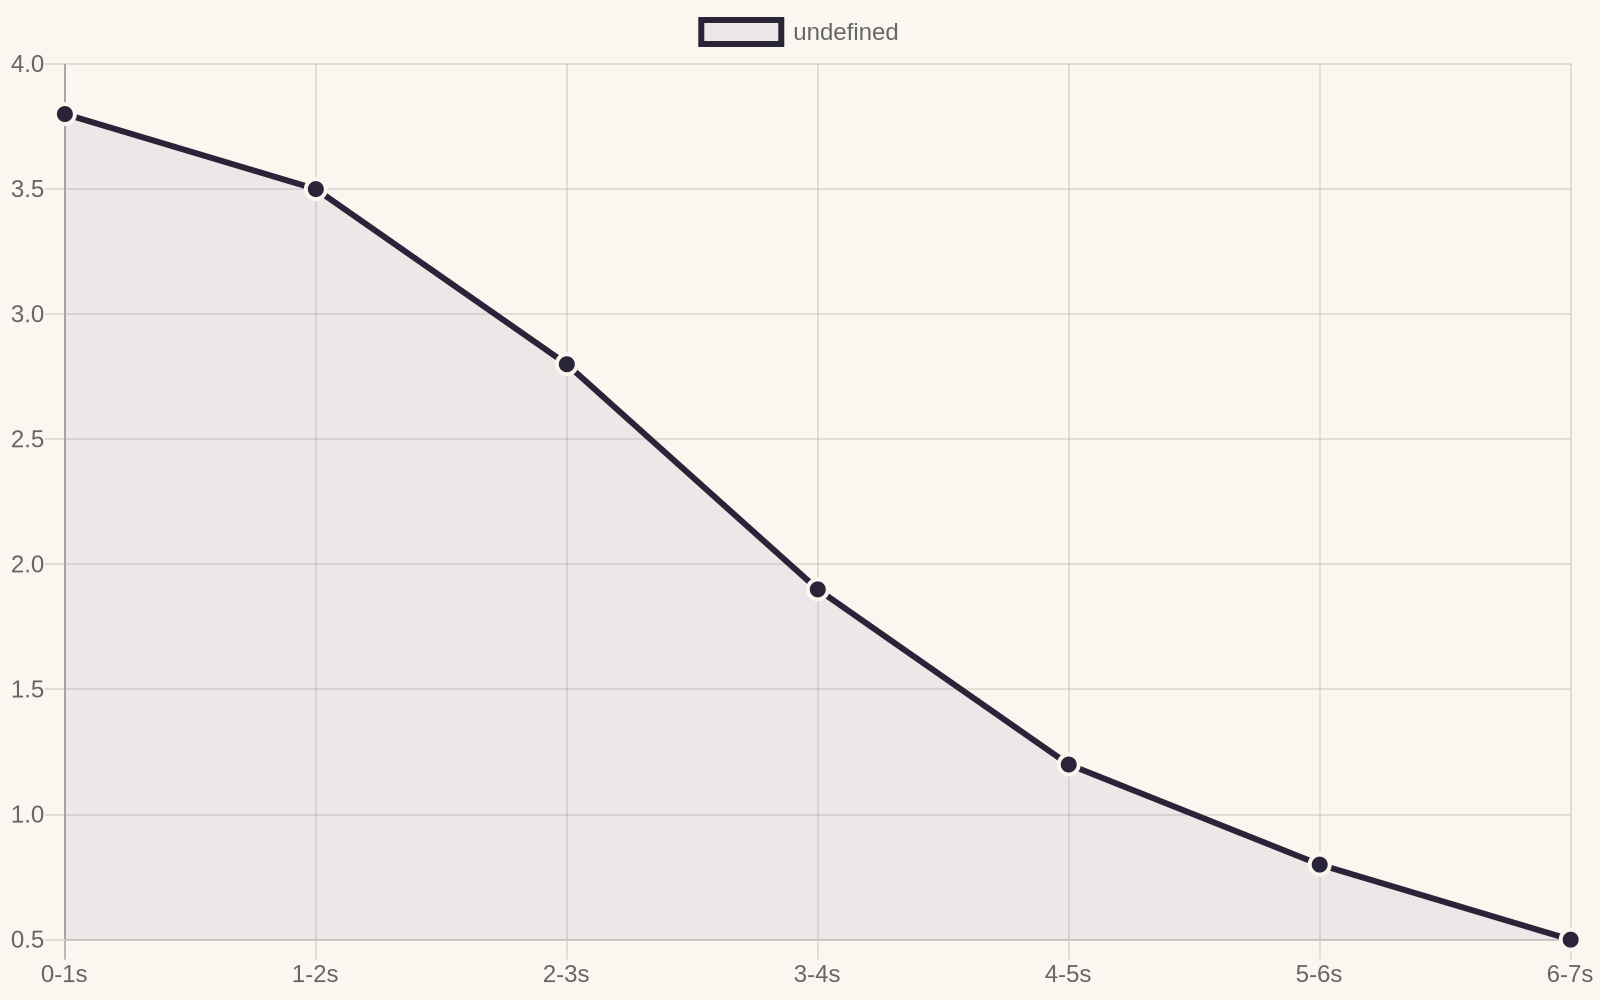
Here are the specific numbers from major studies:
- Amazon found that every 100ms of added latency cost them 1% in sales. They discovered this in 2006, and it remains the most cited statistic in web performance.
- Walmart found that improving load time from 4.4 seconds to 2.9 seconds increased conversions by 2% for every second saved.
- Deloitte’s 2020 study across retail, travel, and luxury sites found that improving mobile speed by 0.1 seconds increased conversion rates by 8.4% in retail and 10.1% in travel.
- Google’s own retail data found that page experience signals (which include Core Web Vitals) increased conversions by up to 24% on mobile.
The pattern is consistent. Small improvements in speed produce outsized improvements in conversions. This is because users do not experience load time as a number. They experience it as friction. Every fraction of a second of waiting is friction between the user and their goal.
If your site takes 4 seconds to load and you generate 10 leads per month from 1,000 visitors, improving load time to under 2 seconds could realistically double that to 20 leads. Same traffic. Same offer. Just less friction.

Desktop vs. mobile: the 3x gap
Here is the part that trips up most website owners. Your desktop load time is not your mobile load time. It is typically 3-4x faster.
The average page loads in 2.5 seconds on desktop and 8.6 seconds on mobile, according to ToolTester’s 2026 analysis. That gap exists for three reasons:
1. Device performance. A mid-range Android phone (the kind Google uses for testing) has a CPU roughly one-third as fast as a modern laptop. It processes JavaScript far less efficiently. A React component that hydrates in 300ms on your MacBook might take 1.2 seconds on a Moto G Power.
2. Network conditions. Mobile connections are variable. A user on a good 5G connection in a city center might experience 50ms latency. A user on a congested 4G connection in a suburban area might see 200-400ms. Google’s default throttling profile for mobile testing simulates a slow 4G connection at 150ms RTT and 1.6 Mbps throughput.
3. Resource weight. Mobile browsers have smaller caches, less memory, and more aggressive resource eviction policies. They are more likely to re-fetch resources that a desktop browser would serve from cache.
Google tests mobile-first. They use the mobile version of your site for indexing and ranking. If your mobile load time is slow, your desktop speed does not matter. This is also why Google’s PageSpeed Insights shows separate mobile and desktop scores, with mobile almost always scoring lower.
If you have only ever tested your site on a laptop over wifi, you are looking at the optimistic version of your numbers. Test on a real mid-range phone on a cellular connection to see what most of your visitors experience.
For more on how Google’s metrics work and what they check, see our plain-English guide to Core Web Vitals.
What makes pages slow (and how to fix it)
If your load time is above 2.5 seconds on mobile, the bottleneck is almost always one of these four things.
1. Large images
This is the most common cause by a wide margin. A typical smartphone photo is 3-5 MB. If you upload that directly to your website without compression, every visitor downloads that full file before the image renders.
Fix: Use WebP format instead of JPEG or PNG. WebP produces files 25-35% smaller at the same visual quality. Resize images to the dimensions they will actually be displayed at. A 4000-pixel-wide image displayed at 800 pixels is 25x larger than it needs to be. Use responsive srcset attributes to serve different sizes to different devices.
2. JavaScript bloat
The average web page ships 500KB of JavaScript, compressed. Uncompressed, that is often 1.5-2MB of code that the browser has to download, parse, and execute before the page is interactive.
Most of this JavaScript comes from third-party scripts: analytics, chat widgets, ad pixels, A/B testing tools, cookie consent banners. Each one adds 50-200KB.
Fix: Audit every third-party script on your site. Remove the ones you do not use. Defer the ones that are not critical to the initial render. Consider a framework that ships zero JavaScript by default, like Astro, and only adds JS where you explicitly ask for it.

3. Slow server response (high TTFB)
If your server takes more than 600ms to respond with the first byte, everything else is delayed. The browser cannot start downloading CSS or JavaScript until it has the HTML. A slow server pushes every subsequent step later in the timeline.
Fix: Use a CDN (Content Delivery Network) to serve cached content from edge nodes close to your visitors. If your site is dynamic, cache as much as possible at the edge. If you are on shared hosting, consider moving to a static site generator or a managed platform with edge caching.
4. Render-blocking resources
CSS and JavaScript in the <head> of your page block rendering. The browser cannot paint anything until these files have been downloaded and parsed. A single 200KB CSS file in the head can delay First Contentful Paint by 500ms or more.
Fix: Inline critical CSS directly in the HTML. Defer non-critical CSS by loading it asynchronously. Move JavaScript to the end of the body or add the defer attribute.
For a complete walkthrough of all optimization techniques, from images to caching to JavaScript, see our web performance guide.
How to measure your page load time
Three tools, each serving a different purpose.
PageSpeed Insights (free). Google’s official tool. Enter your URL and get a mobile and desktop score based on Core Web Vitals and Lighthouse audits. This is the tool that most closely matches what Google uses for ranking. Use it as your primary benchmark.
WebPageTest (free). More detailed than PageSpeed Insights. Lets you test from specific locations, devices, and connection speeds. Shows a filmstrip view of how your page loads frame by frame. Use it when you need to diagnose a specific problem.
Browser DevTools (free). Open Chrome DevTools, go to the Performance tab, and record a page load. This shows you exactly where time is spent: network requests, JavaScript execution, layout recalculations, paint events. Use it for deep debugging.
Run PageSpeed Insights first. If your mobile score is under 50, you have a serious problem. If it is under 90, you have room to improve. Above 90 means you are in good shape, though Google’s “good” threshold for LCP (under 2.5 seconds) is stricter than the Lighthouse score might suggest.
What about Core Web Vitals?
Google uses three metrics collectively called Core Web Vitals to evaluate page experience. They are part of Google’s ranking algorithm, though not the most important part.
| Metric | What it measures | Good threshold | Poor threshold |
|---|---|---|---|
| LCP (Largest Contentful Paint) | Loading speed. When the main content finishes rendering. | Under 2.5s | Over 4.0s |
| INP (Interaction to Next Paint) | Responsiveness. How fast the page reacts to user input. | Under 200ms | Over 500ms |
| CLS (Cumulative Layout Shift) | Visual stability. How much the layout jumps during load. | Under 0.1 | Over 0.25 |
LCP is the metric that most directly answers “how fast does my page load.” If your LCP is under 2.5 seconds, you are in the green. For a full breakdown of all three metrics, see our Core Web Vitals guide.
Performance budgets: setting a target
A performance budget is a self-imposed limit on how much weight and time your pages are allowed to have. Without one, pages grow slowly over time as you add features, scripts, and images. With one, every addition is measured against the budget, and tradeoffs become visible.
A practical starting budget for a business site:
| Resource | Budget | Why |
|---|---|---|
| Total page weight | Under 500 KB | Keeps download under 3s on slow 4G |
| JavaScript (compressed) | Under 100 KB | Most of it is unnecessary on content sites |
| Images per page | Under 200 KB total | Use WebP, resize before upload |
| LCP element | Under 2.5 seconds | Google’s “good” threshold |
| CLS | Under 0.1 | No visible layout jumps |
| Third-party scripts | Maximum 3 | Each one adds latency |
Every time you add a new widget, analytics tool, or plugin, check it against the budget. If adding a chat widget adds 150KB of JavaScript, that is 150KB your visitors download on every page load. Is the chat widget worth the performance cost? Maybe. But you cannot answer that question if you do not know the cost.
How your framework choice affects load time
The technology you build with has a baseline performance cost that you pay on every single page load. This is not about optimization skill. It is about the floor below which you cannot go without changing frameworks.
Here is what a typical 5-page marketing site looks like in different frameworks, measured on a throttled Moto G Power (Google’s default mobile test device):
WordPress with Elementor: 2.8–4.5 second LCP. Ships 400-800KB of JavaScript from plugins, themes, and the page builder itself. Database queries add server response time.
Next.js (SSR): 1.8–3.0 second LCP. Ships 80-200KB of JavaScript for hydration. Faster than WordPress, but still pays the React hydration tax on every page.
Astro (static): 0.6–1.2 second LCP. Ships zero JavaScript by default. HTML is pre-rendered and served from CDN edge nodes. Interactive components are opt-in and scoped to where they are needed.
The gap between these frameworks is not a gap you can close with optimization. A well-optimized WordPress site might get down to 2.5 seconds. An unoptimized Astro site starts at under 1 second. The floor is different.
If your site is a 5-page marketing site for a local business, you do not need React hydration, a database, or a page builder. You need fast HTML, compressed images, and a CDN. Astro ships exactly that, and nothing else unless you ask for it.
Common questions
Is a 3-second load time good enough?
It depends on what you are comparing against. 3 seconds is Google’s “needs improvement” threshold. It means some mobile users will start to notice the wait. If your competitors load in 2 seconds and you load in 3, you are at a disadvantage. If your competitors load in 6 seconds and you load in 3, you have a meaningful edge. Aim for under 2.5 seconds if you can.
What is a good TTFB?
Under 600ms. Google considers under 800ms acceptable, but 600ms gives you headroom for the rest of the loading process. If your TTFB is above 1.2 seconds, your server or hosting setup is the bottleneck.
Does page speed affect SEO?
Yes, but indirectly. Google uses Core Web Vitals (LCP, INP, CLS) as a page experience signal. They are not the most important ranking factor (content relevance and links matter more), but they are a tiebreaker. When two pages have equally good content, the faster one ranks higher. Google also uses mobile-first indexing, so your mobile speed is what counts.
Should I aim for a 100/100 PageSpeed score?
No. Chasing a perfect score leads to diminishing returns. The difference between 90 and 100 is marginal in real-world performance. Focus on hitting the “good” thresholds for LCP (under 2.5s), INP (under 200ms), and CLS (under 0.1). A 92 that stays fast over time is better than a 100 that breaks when you add one more image.
The TL;DR
Here is the answer in one paragraph, if you scrolled to the bottom.
A good page load time is under 2.5 seconds for LCP on mobile, which is Google’s “good” threshold. Pages that load in under 2 seconds feel instant. Pages that take longer than 3 seconds start losing mobile visitors at a rate of 17% and climbing. The average mobile page takes 8.6 seconds. The sites on Google’s first page average 1.65 seconds. If your site is faster than 2.5 seconds on a mid-range phone over a slow 4G connection, you are in good shape. If it is not, the four things to fix are image weight, JavaScript size, server response time, and render-blocking resources.
Speed is not a one-time optimization. It is a decision you make when you choose how to build your site. Build it right and you never have to worry about it again.
Want a site this fast?
Browse our Astro themes. Full source code, SEO-ready, yours forever. From $79.
Browse themes →