
What Is TTFB? Time to First Byte Explained (2026 Guide)
TTFB measures how fast your server responds. Here's what a good score looks like, why it matters (and when it doesn't), and how to fix it — in plain English.
You run your website through PageSpeed Insights. A number shows up in the diagnostics: Time to First Byte — 1.4 seconds. There’s a little orange bar next to it. Something about “server response time.”
What does that mean? Should you care? And what are you supposed to do about it?
That’s what this article is about. No jargon, no assumptions about your technical background. Just what TTFB is, what the numbers mean, and what actually helps.
What TTFB actually measures
TTFB stands for Time to First Byte. It is exactly what it sounds like: the time between your browser asking for a page and the first byte of the response arriving.
Think of it like walking up to a coffee shop counter. You place your order. TTFB is how long until the barista acknowledges you and starts making your drink. It doesn’t include the time to actually brew the coffee — that’s everything that happens after the first byte.
Here’s the thing most explanations skip: TTFB is not one thing. It’s a sum of several steps, each of which can add delay.
Stage 1: DNS resolution
Before your browser can ask a server for a page, it needs to find the server. That means translating your domain name (like yoursite.com) into an IP address. This is DNS lookup.
If your DNS is configured well, this step takes 20-50 milliseconds. If it’s not, it can take 200ms or more. Most people never think about DNS, but a slow DNS provider adds time to every single page load.
Stage 2: Connection setup
Once the browser knows where the server is, it opens a connection. On modern HTTPS sites, this means a TCP handshake (the browser and server exchange SYN/SYN-ACK/ACK packets) followed by a TLS handshake (encrypting the connection).
These two handshakes typically add 50-150 milliseconds depending on network conditions. If you’re on a fast desktop connection, it feels instant. On a 3G mobile network in a rural area, it can take much longer.
Stage 3: The request travels
The browser sends the HTTP request over the connection. The request travels through the network to the server. Depending on how far away the server is, this can take 10-200 milliseconds. A server in the same city responds faster than one on the other side of the world.
Stage 4: Server processing
The server receives the request and starts generating the response. For a static HTML file, this is near-instant — the server just reads the file and sends it. For a dynamic page that pulls data from a database, runs a CMS, or executes server-side code, this step can take hundreds of milliseconds or more.
This is the stage you have the most control over. DNS, connection, and network latency are infrastructure choices. Server processing time is about how your site is built.
What’s a good TTFB score
Google defines three buckets for TTFB in their Chrome User Experience Report (CrUX), the same dataset that powers Core Web Vitals:
| Rating | TTFB (ms) | What it means |
|---|---|---|
| Good | Under 800 | Fast. The server responds before the user perceives any delay. |
| Needs improvement | 800–1,800 | Noticeable. Users on slower connections start feeling the wait. |
| Poor | Over 1,800 | Slow. The page feels unresponsive before it even starts loading. |
The 800ms threshold is Google’s official guidance from web.dev. It is the number PageSpeed Insights and Lighthouse use.
Where most websites actually stand
DebugBear analyzed over 4 million pages and found that the median mobile TTFB across the web is around 1.2 seconds. That means half the internet is slower than that. The average is even worse, dragged up by outlier sites taking 5+ seconds just to send their first byte.
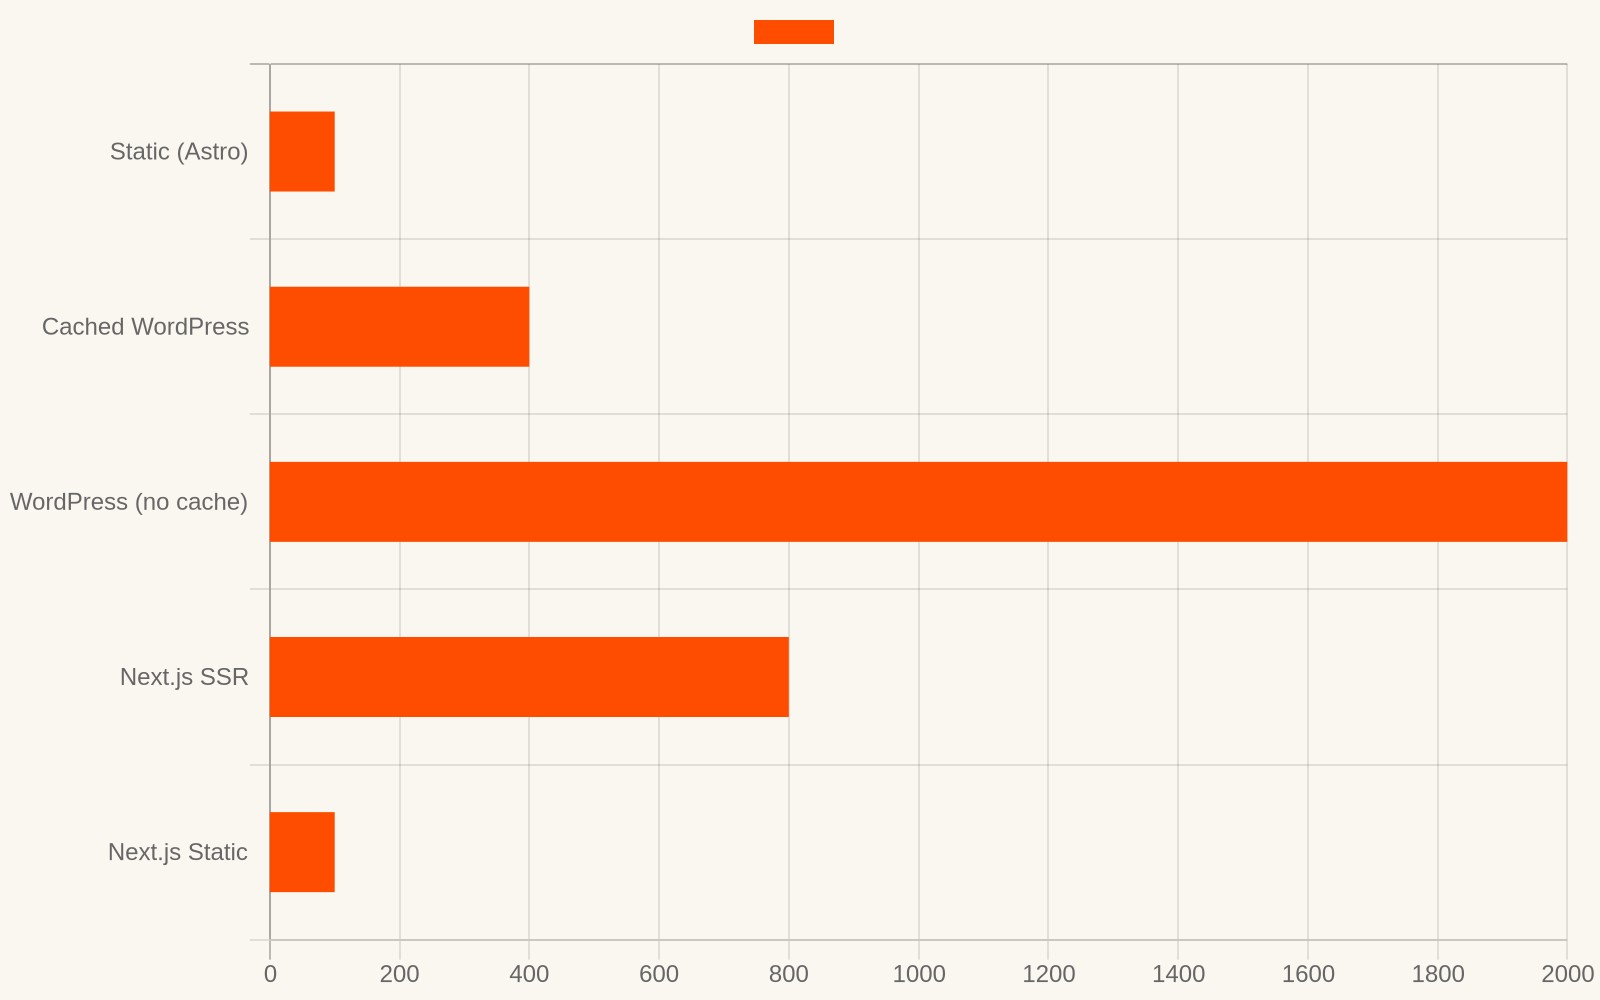
Here’s what that looks like by site type:
- Static sites and CDNs: 100-300ms. These sites serve pre-built HTML from edge locations close to the user. No database, no server-side rendering. Just files.
- Well-optimized CMS (WordPress with caching): 300-600ms. Caching turns dynamic pages into static ones after the first load, but the first uncached request still hits the database.
- Dynamic web apps (Next.js SSR, Ruby on Rails, etc.): 500-1,500ms. Every request triggers server-side code execution and database queries.
- Shared hosting without caching: 1,500-3,000ms+. Budget shared hosting stacks dozens or hundreds of sites on one server. Resources are limited, and response times suffer.
If you don’t know your TTFB, open Chrome DevTools (F12), go to the Network tab, reload your page, and look at the first request in the timing breakdown. The number labeled “Waiting for server response” or “Waiting (TTFB)” is what you’re looking for.
Does TTFB actually matter for SEO
This is where it gets nuanced. And it’s worth getting right, because a lot of the advice online is misleading.
TTFB is not a Core Web Vitals metric. Google does not directly rank pages based on TTFB. The three Core Web Vitals are:
- LCP (Largest Contentful Paint) — when the main content finishes rendering
- CLS (Cumulative Layout Shift) — how stable the layout is
- INP (Interaction to Next Paint) — how responsive the page is to user input
But TTFB is the foundation that LCP is built on. Your page cannot render its main content until the first byte arrives. If your TTFB is 1.5 seconds, your LCP starts its clock at 1.5 seconds — and Google’s “good” threshold for LCP is 2.5 seconds. That leaves only 1 second for everything else: downloading CSS, loading images, executing JavaScript, rendering the page.
A high TTFB makes a good LCP mathematically harder to achieve. Not impossible — you can still get there with aggressive frontend optimization — but you’re fighting uphill.
Cloudflare published research that complicates this picture. They found that about 21% of pages with a “good” TTFB (under 800ms) still had a poor LCP. So a fast TTFB does not guarantee a fast page. But the reverse is also true: a slow TTFB almost always drags LCP down.
The bottom line: TTFB matters because it’s a bottleneck. Everything your page needs to do — load CSS, render images, show text — happens after the first byte. If the first byte is slow, everything after it is slow.
How to measure TTFB properly
There are two ways to measure TTFB, and they tell you different things.
Lab data (synthetic testing)
Lab tools test your page from a controlled environment. They give you consistent, repeatable numbers, but they simulate a single device and connection speed.
- PageSpeed Insights (pagespeed.web.dev): The most accessible tool. Shows TTFB in the “Diagnostics” section under “Server Response Time.” Uses Lighthouse under the hood.
- WebPageTest (webpagetest.org): More detailed. Lets you test from different locations and connection speeds. The “First Byte” column in the results is your TTFB.
- Chrome DevTools: Open the Network tab, reload your page, click the main document request, and look at the Timing tab. The “Waiting for server response” line is TTFB.
Lab data is useful for debugging. It shows you exactly where time is spent. But it doesn’t reflect what your real visitors experience.
Field data (real user monitoring)
Field data comes from actual browsers visiting your site. It accounts for real network conditions, real devices, and real geographic distribution.
- Chrome UX Report (CrUX): Google’s own dataset, accessible through PageSpeed Insights. Shows the TTFB distribution of your real visitors over the last 28 days.
- web-vitals JavaScript library: You can add a small script to your site that measures TTFB for every visitor and sends the data to your analytics tool.
Field data is what Google uses for ranking signals. If your CrUX data shows most visitors have a poor TTFB, that’s the number that matters — not your lab test.
The gap between lab and field
Here’s a common trap: you test your site in PageSpeed Insights and get a great TTFB. But your CrUX field data tells a different story.
Why? Because the lab test runs from a Google data center on a fast network. Your real visitors might be on mobile networks in different countries. The lab test doesn’t account for redirects (if your site redirects from HTTP to HTTPS, or from www to non-www, each redirect adds a full DNS + connection + request cycle).
If your field TTFB is much worse than your lab TTFB, the usual suspects are redirects, geographic distance to your server, or a CDN that isn’t configured to cache your HTML.
What actually increases TTFB
Before fixing TTFB, you need to know what’s causing it. Here are the most common culprits, roughly in order of frequency.
1. Slow hosting or overloaded servers
This is the number one cause of high TTFB for small business websites. Cheap shared hosting packs hundreds of sites onto a single server. When traffic spikes, your site waits in line.
If your server takes more than a second just to start responding, and your site isn’t doing anything complex, hosting is almost certainly the issue. No amount of caching or optimization can fully compensate for a server that’s fundamentally too slow.
2. No caching
Without caching, every page request triggers a fresh round of database queries, template rendering, and server-side processing. With caching, the server saves the finished HTML and serves it directly on subsequent requests — effectively turning a dynamic page into a static one.
For CMS sites (WordPress, Drupal, Ghost), page caching is the single most effective TTFB optimization. It can drop TTFB from 2 seconds to under 200ms.
3. No CDN
A CDN (Content Delivery Network) serves your content from locations around the world. Without one, every visitor’s request travels to your origin server and back. If your server is in New York and your visitor is in Singapore, the round trip alone adds 200-300ms.
With a CDN, the Singapore visitor’s request hits a CDN edge server in Singapore, which may have your page cached and ready to serve in under 50ms.
4. Too many database queries
Dynamic sites that pull data from a database on every request are inherently slower than static sites. An e-commerce page might run 50+ database queries to build product listings, prices, reviews, and recommendations. Each query adds a few milliseconds, and they add up.
Solutions include query optimization, object caching (Redis, Memcached), and — most effectively — full-page caching that bypasses the database entirely for cached pages.
5. Redirect chains
Every redirect adds a full request cycle. A common scenario: a visitor types yoursite.com, which redirects to www.yoursite.com, which redirects to https://www.yoursite.com. That’s three DNS lookups, three connection setups, and three round trips before the first byte of actual content arrives.
Minimizing redirects — especially on the initial page load — is one of the easiest TTFB wins.
6. Heavy server-side rendering
Modern frameworks like Next.js, Nuxt, and Remix can render pages on the server for each request. This is powerful but expensive. If your server-side rendering involves complex computations, API calls, or large data transformations, TTFB will suffer.
The solution is often incremental static regeneration (ISR) or static generation — render the page once at build time, not on every request. This is the core principle behind static site generators like Astro.
How to reduce TTFB: practical steps
Now for the part most articles skip: what to actually do.
Step 1: Measure first
Before changing anything, measure your current TTFB from both a lab tool (PageSpeed Insights) and, if available, field data (CrUX). Note the number. You need a baseline to know if your changes are working.
Step 2: Fix your hosting
If you’re on $3/month shared hosting, no optimization trick will save you. Upgrading to a VPS ($5-10/month from providers like DigitalOcean, Hetzner, or Vultr) or managed hosting with server-level caching can cut TTFB by 50-80% overnight.
If you’re using a CMS like WordPress, look for hosts that offer PHP-FPM, OpCode caching, and object caching out of the box. These are server-side optimizations that make a measurable difference.
Step 3: Add a CDN
Cloudflare’s free plan covers most small business needs. It caches your static assets (images, CSS, JavaScript) at edge locations worldwide and can optionally cache full pages. Setting it up takes about 15 minutes: create an account, add your domain, change your nameservers, and you’re done.
For full-page caching through a CDN, you need to configure “cache everything” rules carefully — you don’t want to cache a logged-in user’s personalized content. But for public pages like your homepage and blog posts, CDN page caching is extremely effective.
Step 4: Enable page caching
If your site runs on WordPress, install a caching plugin. WP Rocket and W3 Total Cache are popular options. They generate static HTML versions of your pages and serve those instead of hitting the database every time.
For other platforms, check if server-side caching is available. Nginx FastCGI cache, Varnish, and Redis full-page cache all achieve similar results at the server level.
Step 5: Minimize redirects
Audit your redirect setup. Ideally, visitors should reach your HTTPS, canonical URL in a single hop. Use your server configuration (not plugins) to handle HTTP→HTTPS and www→non-www redirects in one step.
Check for unnecessary chain redirects using a redirect checker tool. Each redirect in a chain is a wasted round trip.
Step 6: Move to a static architecture
This is the nuclear option, and it’s increasingly the right answer for many websites. If your site is primarily content — a business homepage, a blog, a portfolio, a landing page — you probably don’t need a server generating HTML on every request.
Static site generators build your pages once, at deploy time. The output is plain HTML files that a CDN can serve from anywhere in the world. TTFB drops to whatever the CDN’s nearest edge location can deliver — often under 100ms.
This is exactly what Astro does, and it’s why Astro sites consistently achieve some of the fastest TTFB scores on the web. Pages are pre-built HTML, deployed to a CDN, and served from edge locations. No database queries. No server-side rendering. No PHP execution. The server just sends a file.
For a deeper comparison of static versus dynamic approaches, see our complete web performance guide.
TTFB by platform: what to expect
Here’s a rough guide to what TTFB you can expect from different website platforms, assuming reasonable configuration:
| Platform | Typical TTFB (with CDN) | Typical TTFB (no CDN) | Why |
|---|---|---|---|
| Static site (Astro, Hugo, 11ty) | 50-150ms | 100-300ms | Pre-built HTML served directly. No server processing. |
| WordPress with page caching | 150-400ms | 300-800ms | Cached pages are near-static. First uncached load still hits the database. |
| WordPress without caching | 600-2,000ms | 1,500-4,000ms | Every request runs PHP + database queries. |
| Next.js (SSR) | 300-800ms | 500-1,500ms | Server-side rendering on every request unless using ISR/static export. |
| Next.js (static export) | 50-150ms | 100-300ms | Same as static site generators — pre-built HTML. |
| Shopify | 200-500ms | N/A (Shopify includes CDN) | SaaS platform with built-in CDN and caching. |
| Webflow | 150-400ms | N/A (Webflow includes CDN) | SaaS platform with global CDN. |
The pattern is clear: static is fastest, cached dynamic is acceptable, uncached dynamic is slow. SaaS platforms are a mixed bag — they handle caching for you, but you’re locked into their infrastructure.
Common TTFB myths
Myth 1: “A good TTFB guarantees a fast website”
No. Cloudflare’s data showed that 21% of pages with good TTFB still had poor LCP. A fast server response means nothing if your page then loads 3MB of images and 500KB of JavaScript. TTFB is necessary but not sufficient.
Myth 2: “TTFB is a Google ranking factor”
Not directly. Google ranks based on Core Web Vitals (LCP, CLS, INP), not TTFB. But TTFB is a prerequisite for good LCP, which is a ranking factor. It’s an indirect relationship.
Myth 3: “You need a VPS to get good TTFB”
Not always. A static site on Cloudflare’s free CDN can achieve sub-100ms TTFB from anywhere in the world. The key is what happens between the request and the response — if your server doesn’t need to do any work, the response is fast regardless of how powerful the server is.
Myth 4: “Gzip increases TTFB so you should disable it”
This one has a grain of truth. Gzip and Brotli compression buffer the response before sending it, which can marginally increase TTFB. But the total page load time decreases dramatically because fewer bytes are transferred. Disabling compression to improve TTFB is like removing your car’s brakes to reduce weight — technically lighter, practically worse.
The TTFB checklist
If you read this far and just want a quick action list:
- Check your TTFB with PageSpeed Insights or Chrome DevTools
- Compare lab vs field data — if field is much worse, look for redirect chains or geographic distance
- If on cheap shared hosting, upgrade — this alone fixes most TTFB problems
- Add a CDN (Cloudflare free tier) — serves content from edge locations
- Enable page caching if using a CMS — turns dynamic pages into static ones
- Minimize redirects — especially on the initial page load
- Consider going static if your site is content-focused — Astro, Hugo, or 11ty eliminate server processing entirely
- Measure again — verify your changes actually moved the needle
TTFB is not the most glamorous performance metric. It doesn’t have the name recognition of “page speed” or “Core Web Vitals.” But it sits underneath all of them. Fix your TTFB, and every metric above it improves — including your overall page load time.
For a broader look at how TTFB fits into the full picture of web performance — including Core Web Vitals, LCP, and how Google measures your site — read our complete web performance guide. And if you want to understand the metrics that Google actually ranks on, our Core Web Vitals explainer breaks them down in plain English.
Want a site this fast?
Browse our Astro themes. Full source code, SEO-ready, yours forever. From $79.
Browse themes →